Signal Interface Group offers a complete solution for acoustic imaging: the ACAM 120 Acoustic Array, the SIG Windows driver, and the BeamformX program from OptiNav. OptiNav, a world leader in acoustic imaging software, developed BeamformX specifically for SIG acoustic arrays.
Plug in the USB cable, install the software, and see useful results within minutes:
BeamformX displays acoustic images in real time, and it optionally saves processed data as mp4 video files.
BeamformX also can save raw data: acoustic data from all microphones, along with images from the optical camera. BeamformX as a post-processing program can process one raw data file with various options and parameters.
The video and the images on this page were made from one raw data file.
BeamformX displays acoustic data in three main windows: Display Window, Spectrum Window, and Spectrogram Window.
The images below show only the basic functions. BeamformX
has many additional features for real-time processing and
for post-processing.
The Display Window shows the acoustic image, in color, overlaid on an optical image, in gray scale. The data source can be either the ACAM 120 acoustic array or a raw data file.
A small chart in the lower right corner of the Display Window shows the color for each dB level. Text overlays show the center frequency, the distance to the subject, and optional parameters.
A rectangle can be selected with the mouse as a region of interest (ROI).
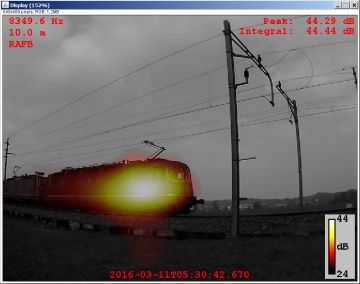
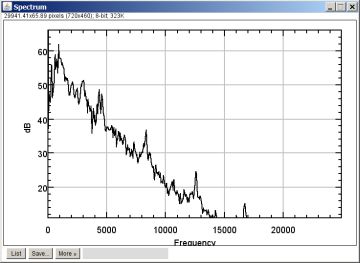
The Spectrum Window shows the amplitude of the spectrum of a typical microphone. Selecting a point in the spectrum selects the center frequency for acoustic signal processing. The Display Window above shows the acoustic image corresponding to the peak in the spectrum at 8.5 kHz in this Spectrum Window.
BeamformX has three options for acoustic signal processing: 1/3 octave band, 1/12 octave band, or single frequency.
The spectrum is updated in real time. It can be saved as a text file for additional processing.
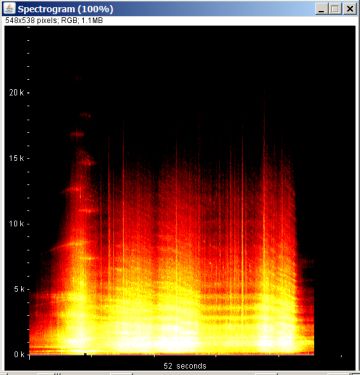
The Spectrogram Window shows the spectrum as a color map evolving in time, with frequency on the vertical axis.
In the spectrogram image, yellow denotes higher sound pressure level. In this example there are quiet periods before and after a train passes the acoustic array, and a period of higher sound pressure and higher frequency as the train passes.
BeamformX maintains a buffer, typically between 30 seconds and two minutes. Interactive controls stop the real-time display, select times and frequencies of interest in the spectrogram, and replay the acoustic image. Save raw data and mp4 video files either in real time or from the buffer.
The lower frequency limit for beamforming is the frequency at which the hardware and software can resolve sufficient details for an application. The lower frequency limit depends strongly on the application. It can be below 600 Hz or as high as 2 kHz, with a typical value of 1 kHz. Many acoustic sources are rich in harmonics and can be located using their harmonics.
The upper frequency limit for beamforming is about 24 kHz.